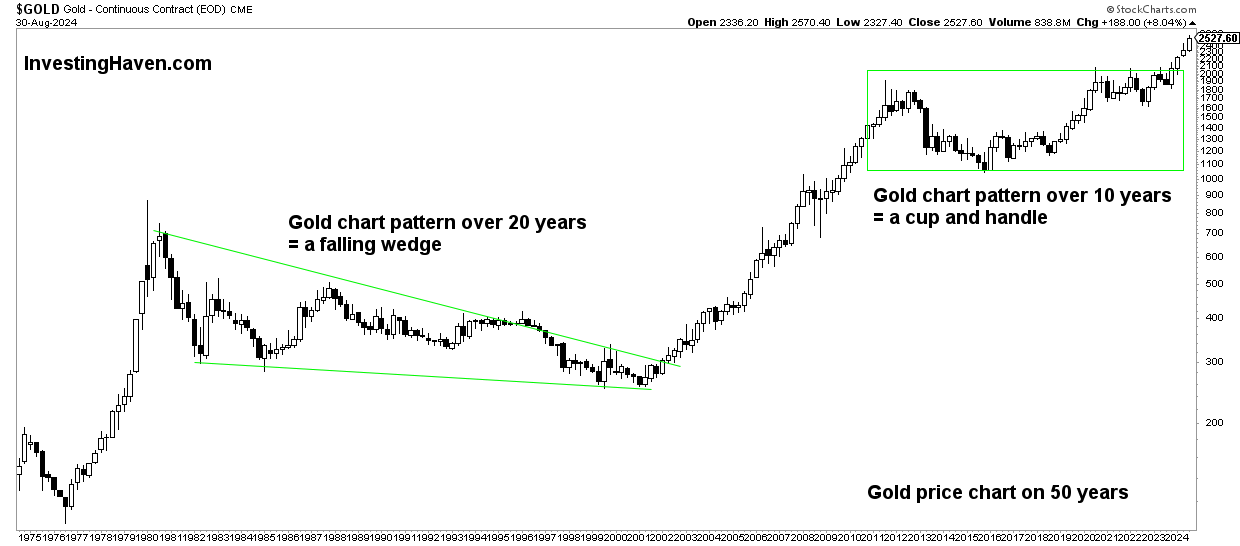
Gold completed its powerful bullish cup and handle chart pattern on March 4, 2024. Therefore, gold is expected to continue reaching new all-time highs in 2025.
RELATED – A Gold Price Prediction for 2025 to 2030.
Gold has stood the test of time as a reliable measure of prices and as a symbol of stability in times of economic uncertainty. Given rising prices across all sectors, it is no surprise that the gold price is also following suit.
While gold may not have risen significantly in relative terms due to central banks’ disinflationary monetary policies, it is only a matter of time before it catches up and reaches new all-time highs (ATH).
The long term gold price chart (gold to USD) has a setup that confirms gold’s intention to move higher. In terms of leading world currencies other than USD, gold has consistently generated new ATH through 2024.
Is gold expected to hit a new all-time high (ATH)?
This article examines the factors behind gold’s objective price measure and its potential to rise in major world currencies, ultimately answering the questions “is gold expected to move higher” and “is gold on track to reach new all-time highs.”
In this article we use an objective and data-driven approach. We try to avoid bias and preferences at all costs.
Therefore, we will cover the following points to answer the above questions:
Why invest in gold when interest rates are rising?
With interest rates reaching levels not seen since 2001, investors are faced with tough decisions about where to spend their money.
While assets such as bonds can offer attractive returns in a rising interest rate environment, gold remains a preferred choice due to its ability to retain value during times of inflation and to inspire confidence during economic uncertainties.
The price of gold often reflects market sentiment and acts as an inflation hedge and/or safe haven in times of crisis.
Note that our point is that gold can rise in response to inflationary pressures, or in times of crisis, or both. The latter does not happen often. We try to pinpoint the dominant dynamics that influence the gold price.
Gold as an objective measure of prices
- Amid rising inflation rates and skyrocketing prices, gold stands as a benchmark for real value.
- As all prices rise, the price of gold inevitably follows suit, albeit with a slight delay. We attribute this slowdown to the disinflationary monetary policies pursued by central banks worldwide.
- But despite this slowdown, gold’s reliability as a price gauge remains unparalleled, making it an essential asset for investors looking for an objective anchor in turbulent times.
The disinflationary effect on gold
Central banks’ disinflationary monetary policies prevented gold from rising in 2022-2023, despite high inflation levels.
Because these policies were aimed at stabilizing or lowering the general price levels of goods and services, they did have an impact on gold’s upward trend. However, it is essential to recognize that these disinflationary policies are temporary and do not reflect the long-term value of gold.
Ultimately, as inflationary pressures increase and the impact of central bank policies decreases, gold will rise and offset the relative slowdown experienced during the disinflationary phase.
Moreover, as evidenced by the latter monetary newspolicymakers are starting to do reduce rates.
This is happening at a time when central banks buy large amounts of physical goldwith the intention of protecting them
So while the origins of central banks buying gold may have changed over the years, the reasons for holding the assets have changed little.
Gold Price Chart: Gold Cup and Handle Chart Pattern
The gold chart over a 50-year period shows a distinct pattern known as a “cup and handleA turnaround that bodes well for gold’s future prospects. The cup and handle pattern is a bullish continuation pattern.
It typically indicates a brief pause in an uptrend before the price resumes its upward trajectory. In this context, the ‘cup’ part of the pattern represents the gradual decline in the price of gold, forming a rounded bottom. Conversely, the “handle” is a small retracement that follows the cup formation.
The chart shows this pattern, indicating a possible bullish breakout in the gold price. The cup formation, which spans several decades, indicates a long-term accumulation phase, during which investors have gradually built up positions in gold.
When the cup formation ends, the handle section serves as consolidation before the next upward movement. That’s exactly what started happening in March 2024 – it marked the beginning of a new bull market!


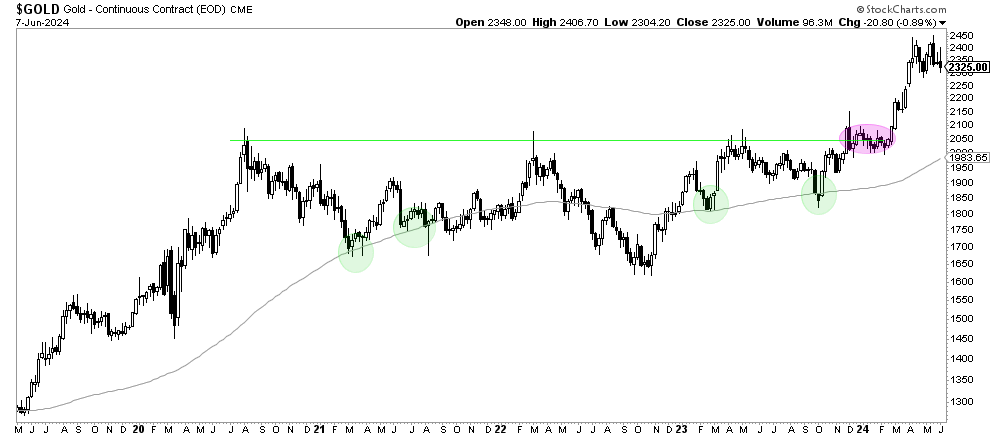
We now zoom in on the gold price chart and look at the 5-year gold chart.
Clearly, the series of reversals since summer 2020, which constitutes the consolidation, looks very bullish.
The long-term moving average on the weekly gold price chart is rising and the price is well above this moving average.


The takeaways:
The gold cup and handle reversal pattern and gold’s long-term channel paint a promising picture for gold’s future prospects. Analysis of the gold price charts confirmed that a bullish breakout would occur in 2024, as early as 2023, it happened on March 4, 2024, a date for the history books.
However, keep in mind that the charts above show the price of gold in USD. These gold price charts alone suggest with a high level of confidence that gold wants to move higher and reach new all-time highs.
Things will get even more interesting, as we will see in the following paragraphs, when we look at gold denominated in currencies other than the US dollar. It is important to highlight that gold has already created new ATH in several leading world currencies.
Gold in leading currencies
Investors measure the price of gold primarily in USD. The price of gold when expressed in other leading world currencies such as the Japanese yen and the Australian dollar emphasizes the value of gold.
Therefore, it is to some extent misleading to focus only on the gold market when looking at the gold price chart in US dollar terms.
Over the past twelve months, these currencies, in combination with gold, have shown a pronounced upward trend. This demonstrates the power of gold as an objective measure of prices across different regions, providing investors with protection and stability in relative terms.
The most stark picture is how gold has performed over the past four years, in terms of nine leading world currencies. All these charts show a strong upward trend:
- Either in the form of a sustained uptrend – gold in Japanese yen, gold in Indian rupee, gold in British pound),
- or in the form of a W-reversal in the form of a rounded reversal, which is a very powerful chart pattern – gold in Chinese renminbi, Swiss franc, South African rand.
Below you will find the four-year gold price charts expressed in twenty leading world currencies. The gold is visible in a secular uptrend in all global currencies, regardless of a possible pullback that could occur in 2024.


Is gold expected to rise?
As the era of monetary tightening nears its end, the spotlight is on the gold price trajectory and indications are becoming increasingly optimistic.
Over the past decade, the value of gold in several global currencies has soared, demonstrating its resilience and appeal as an investment choice.
Gold has performed remarkably bullishly over the past twelve months. Gold is expected to continue rising even as it returns to the March 2024 breakout point at $2,100 per Ounce.
Is gold about to soar to new all-time highs?
Gold is likely to continue reaching new all-time highs in 2025. The relative delays turned out to be temporary.
The objective benchmark for prices that gold represents, coupled with its potential in leading world currencies, consolidates its position as a valuable asset in any well-diversified investment portfolio.
The enduring appeal of gold as an objective measure of prices is undeniable. While the economy may have experienced a relative slowdown due to disinflationary policies, the long-term trajectory points toward new record highs.
Inflationary pressures have gone up a lot, interest rates have gone up a lot, and yet gold has shown resilience. As soon as central banks started thinking about a rate cut in early 2024, gold experienced a secular breakout. This happened when inflationary pressures seemed clearly under control.
In leading currencies such as the Japanese yen and the Australian dollar, gold’s strength is clearly visible, confirming its status as a universal store of value. With the potential for central banks to adopt more inflationary policies, gold is likely to move higher and reach new all-time highs.

